Wardley Mapping in Enterprise Architecture (also, upcoming workshop)

A little while ago, we ran a very well received webinar with Simon Wardley presenting the essentials of his innovative mapping approach.

We have been working to integrate this into our enterprise and business architecture meta models and approach. Early results are encouraging. We have found the following:

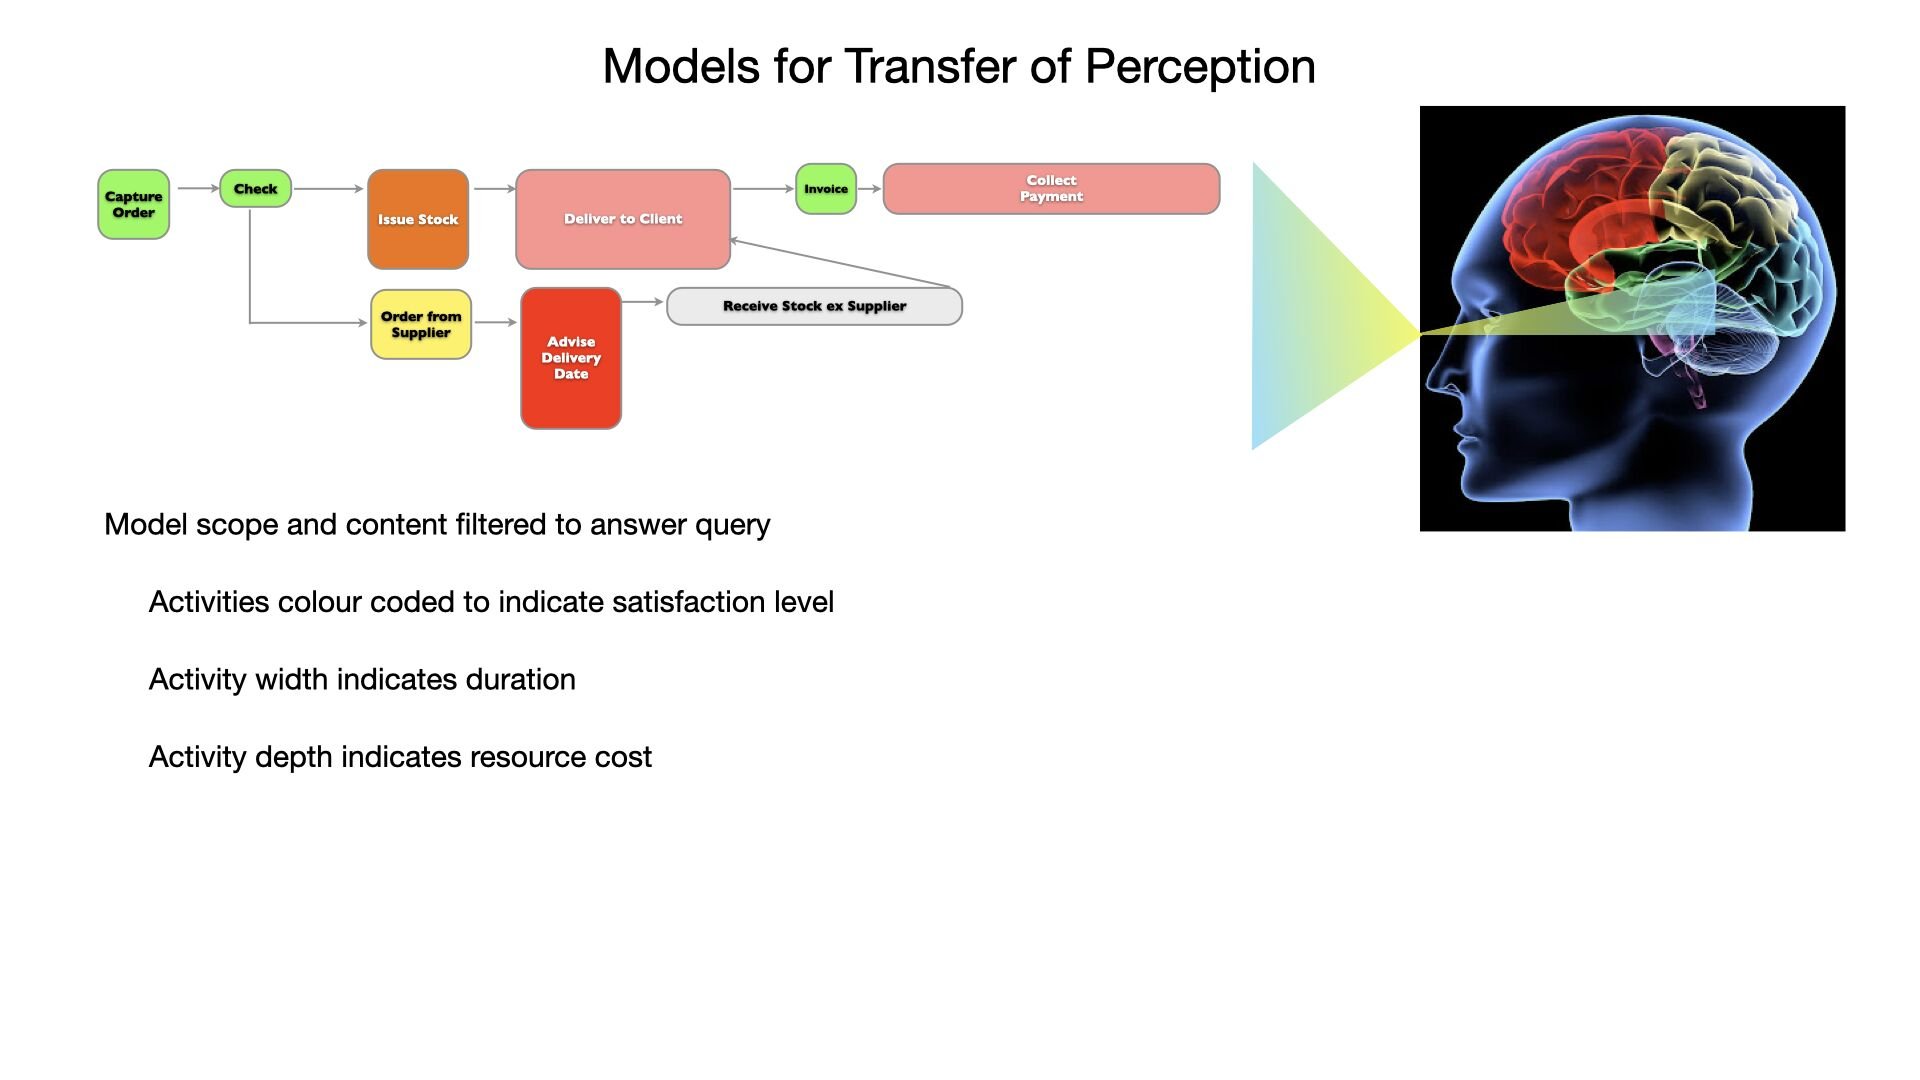
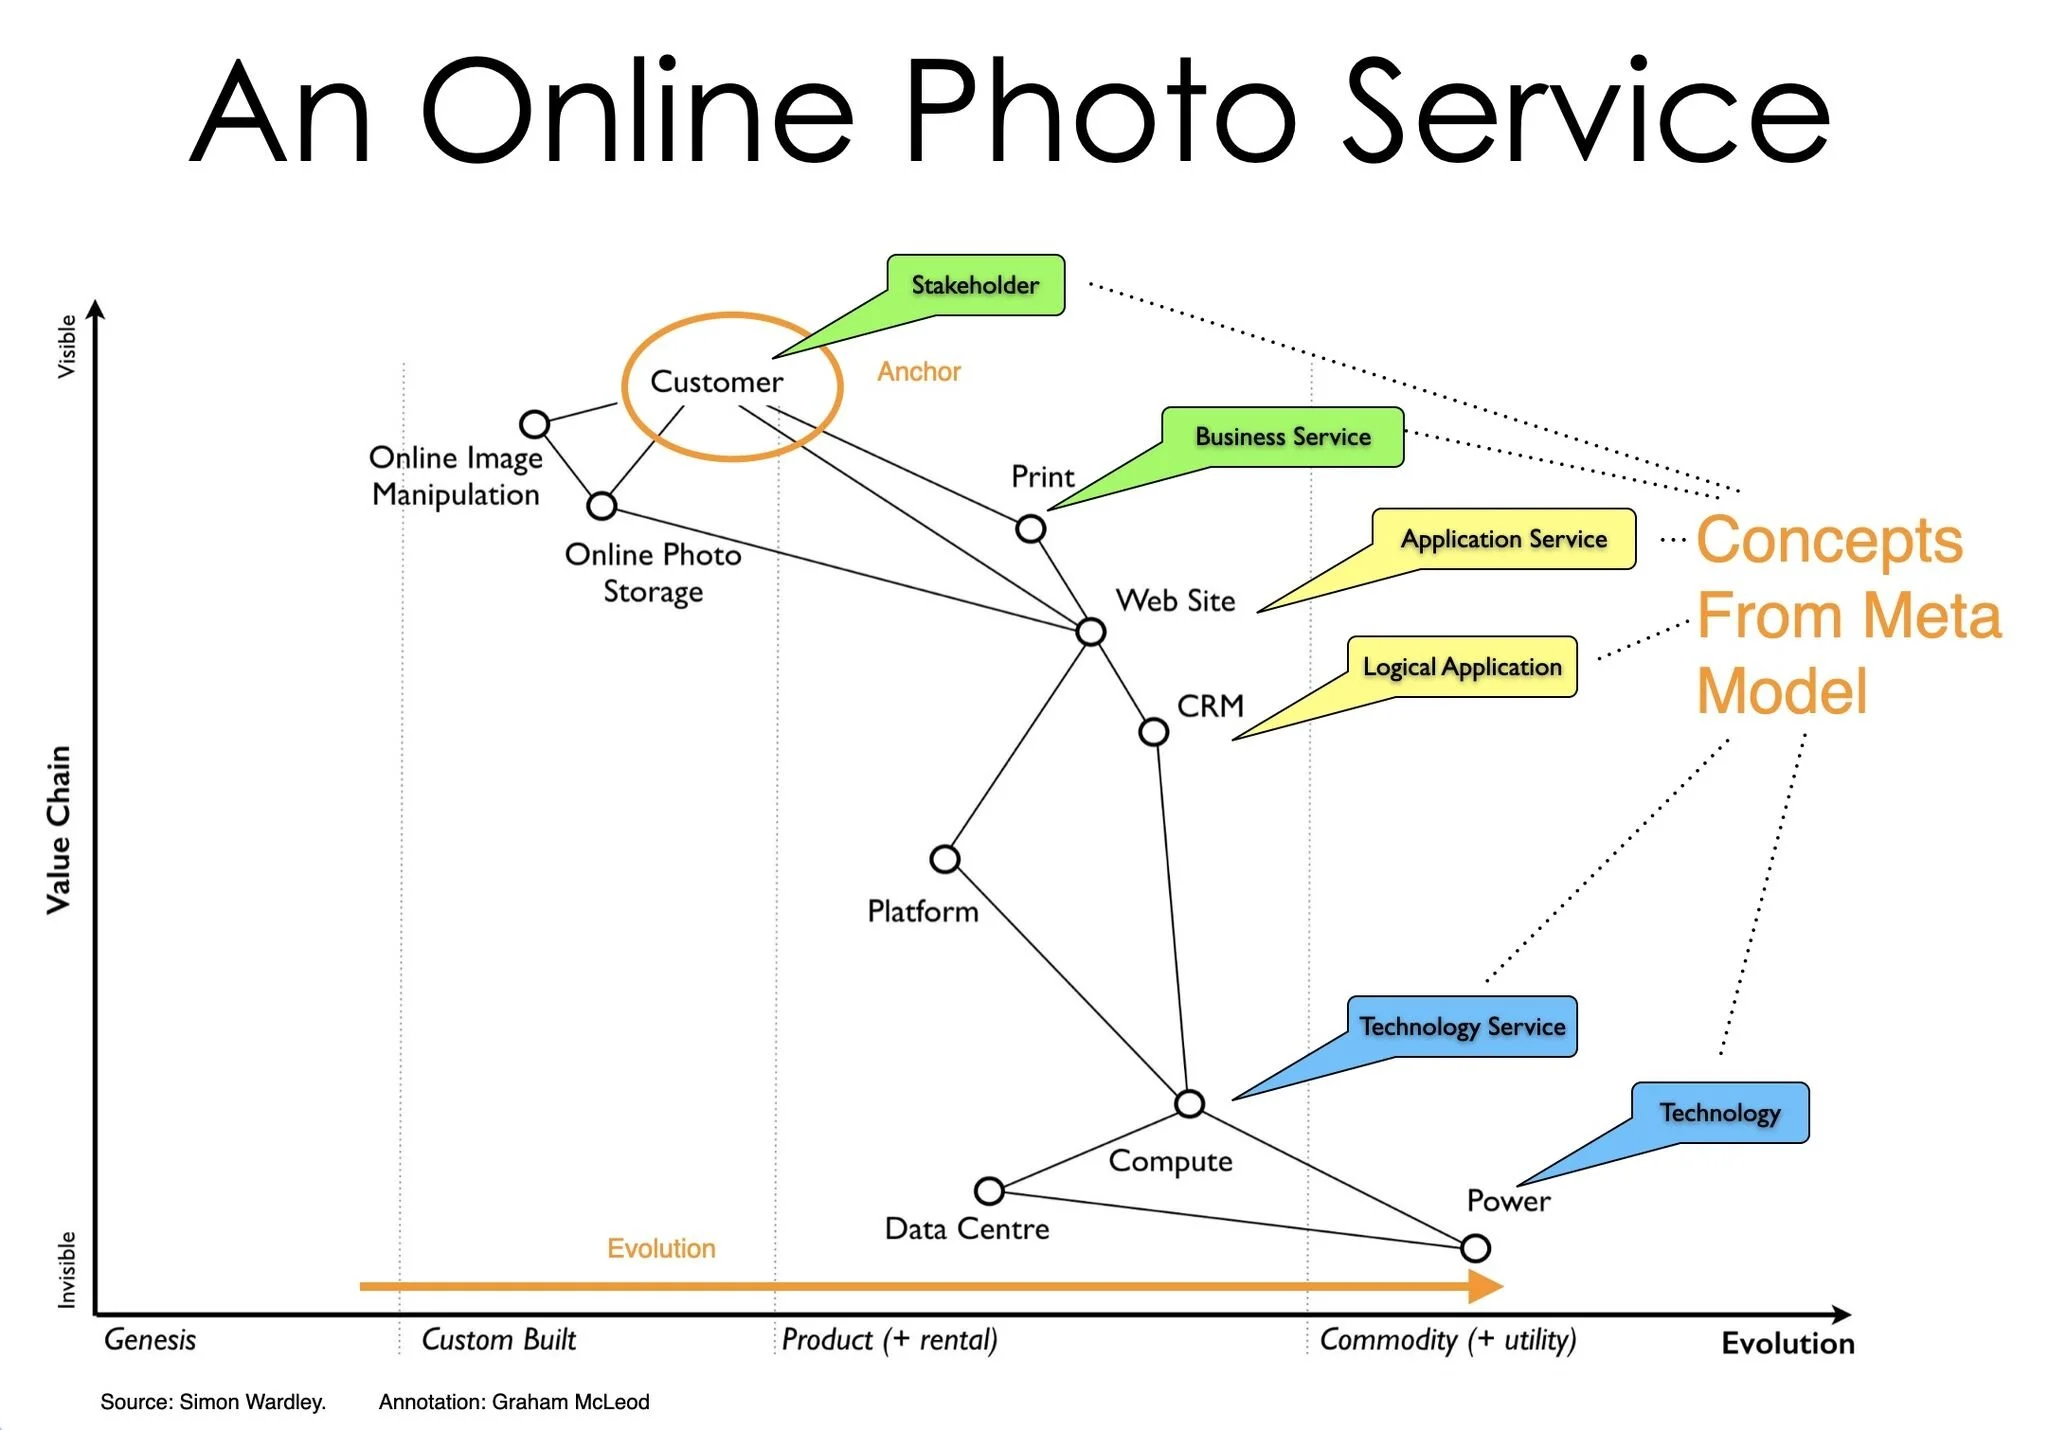
  • Maps can be thought of as similar to graphical models, but with axes that facilitate placing elements in spatial dimensions (specifically how close to the delivery of value / visibility to client they are (Y axis) VS how evolved they are in terms of how they are delivered (X axis). This means we can easily adapt existing graphical models and tools to also have axes and support maps

  • The elements in the maps range from Customers (one subtype of Stakeholder), through Products and Services (Offerings), the elements necessary to deliver these (e.g. Processes, Systems) and those supporting them (e.g. Technology, Data). The good news is that these are already included in our Holistic Architecture Language meta model and have associated visual representation. We can use our existing ones or just dots as preferred

  • The idea of evolution fits well with our existing concepts of Maturity Level for various elements and capabilities

Bottom line: Mapping fits very well and provides additional value by allowing identification of trends and potential scenarios. It also allows visual grouping that helps planning in terms of suitable methods, responsibilities and timing.

We are holding an initial one day workshop on leveraging mapping within architectures for those who would like to dig deeper…

See this page for more information on the Wardley Mapping for EA Workshop

Image Credit: Simon Wardley

Annotation: Graham McLeod

Is Architecture still Relevant when we are Agile; Moving Everything to Cloud; Going AI?

You still need to:

  • know where you are and what you have and what state it is in

  • know what you want (at least at a conceptual / business level)

  • know what you need to move from current to future

  • guide choices, implementation and make tradeoffs between paths of action

  • have relevant data, information and content to deliver the products and services and make decisions

  • evolve your application and technology landscapes to take advantage of developments while managing risk, security, privacy and efficiency concerns

  • partition work across teams in a way that allows their results to be integrated

  • have a realistic roadmap to manage expectations across customers, business and technical teams

  • manage quality of implemented solutions to ensure service, customer experience and future maintainability

Of course, properly chosen and employed, AI can help with many of these!

Alan Kay’s Remarkable Contributions

Most of us use the fruits of the ideas and work of Alan Kay and his team at Xerox Palo Alto Research Centre (PARC) every day, but few know his contribution in detail.

Alan studied at Utah in the 1960’s and was fortunate to encounter the work of early pioneers in computer graphics (Ivan Sutherland at MIT), the first mouse (Doug Engelbart at Stanford) and objects and classes in Simula ( Ole-Johan Dahl and Kristen Nygaard in Norway). He was also exposed to the Arpanet (precursor of the Internet) through DARPA. His PhD thesis involved creation of an early personal computer (the Flex Machine). He conceived of a future product, which he called the Dynabook, which we would now recognise as an iPad. One key difference: Alan wanted the device to be maleable by the user (programmable even by children) rather than a device for media consumption.

Alan and his small team at Xerox (usually < 20 people) invented the first GUIs, developed object oriented programming and Smalltalk to write their operating environment and applications, produced the concept of bit-mapped graphics, overlapping windows, WYSIWYG editing, laser printing, local area networks (Ethernet), Integrated Development Environment (IDE) tools. They employed garbage collection, virtual machines, runtime images and late binding decades before these became mainstream. All this between 1970 and around 1976.

The ideas from this group had a profound impact on the industry, being picked up by Apple in their creation of the Macintosh, and later Microsoft who followed Apple. There was also an early WYSIWYG word processor (done by a different team, but using similar environment) called Bravo, that evolved through an intermediate product to Microsoft Word. Object oriented programming became the dominant programming model from the late 1980’s through 2020.

Alan went on to work at Apple, where he was instrumental in the creation of the open source Smalltalk variant Squeak, much loved in the education community. This in turn was forked to Pharo which is a very capable open source Smalltalk system, widely used in education, research and commercial systems.

He had a brief stint at Hewlett Packard as a head of research, but the culture was hostile and he left to found Viewpoints Research where he continued to push the boundaries and inspire another generation of researchers. A notable achievement of this group was the creation from scratch of a complete personal computing environment (operating system, communications, word processing, spreadsheet, presentation graphics etc. ) done in less than 10 000 lines of code. An exception was a web browser - not achievable without massive effort due to many broken, incomplete and conflicting standards… See STEPS project if interested.

Alan is a many faceted individual, also making contributions in music, teaching methods and mathematics.

Thanks Alan!

(And Happy Birthday for the 17th)

Remembering a Titan - Claude Shannon born 30 April 1916

A gentle, curious and humble man ranking with Einstein in terms of achievements.

At the age of 22 his masters thesis at MIT married Boolean logic and circuit design to introduce the fundamentals of digital computing with AND and OR gates, at the time implemented with relays, later transistors.

A few years later he introduced concepts of encoding various types of information (text, voice, image, video...) onto binary digits (bits).

Applying his mathematical skills to another field, he completed a PhD in genetics and transmission of characteristics between generations.

He went on to formally define information and quantify its size, allowing calculation of the threshold limit, the theoretical maximum bandwidth that a channel can carry. He introduced error correction of digital information, with huge implications for the transmission and storage of digital information. These principles were also used by von Neuman in making digital computing with unreliable components reliable. His work resulted in the conversion of telephone and communication networks from analogue to digital.

He made major contributions to compression and security technology, including providing the secure voice communications used between Churchill and Roosevelt during WW2.

Shannon also contributed to early AI by building a maze solving mouse and a chess playing computer. He co-organised the first AI conference in Dartmouth in 1956.

He is today recognized as the father of information theory. His work underpins our devices, computing, communications, digital media, encryption, compression - in short the fabric of the modern world. His contributions rank with those of Einstein, Newton and Darwin.

His quirks included juggling, riding a unicycle and making various crazy devices just for fun.

We owe him a great deal! Thanks Claude.

Claude Shannon Wikipedia Article

Canvasses on Steroids

A popular technique for quickly understanding or planning a business is the Business Model Canvas, introduced by Alexander Osterwalder and Yves Pigneur. This provides a high level ontology in the form of a one page diagram with boxes for key elements of a business.

The canvas idea has also been used for assessing other things including Business Value Proposition; Blue Ocean Strategy Ideas and Product and Service Innovations. There are a number of advantages to the canvas:

  • It is quick and easy to use

  • It is accessible to non-technical executives, managers and domain experts without modelling knowledge

  • It is concise and low effort

  • If well designed, it focusses attention on key concepts (provides ontology)

  • It can be done for baseline and proposed scenarios and comparison

However, there are also drawbacks and limitations:

  • It is often just a diagram with little formality of definition behind the concepts or consensus on what each category actually means
    (Resources may include People, Skill, I.P., Cash, Plant… )

  • Users often mix concepts and instances in completing the blocks
    (Retail Customers, Govt. Dept of Energy…)

  • There is insufficient detail behind the entries to perform more detailed analysis
    (For Revenue Streams we may list Hardware Sales, Software Sales and Services, but we don’t know that these contribute in the proportion 60%, 35%, 5%)

  • Relationships and dependencies are not apparent
    (Which Partners or Resources or Activities are necessary to offer a particular Value Proposition?)

To solve these issues, facilitate richer analysis and integrate the elements in the canvas with other enterprise models and architecture elements, we implemented advanced features for canvasses in our Enterprise Value Architect (EVA) tool platform:

  • Users can define canvasses using any concepts defined in the meta model (also user definable). Concepts are represented by user friendly names and icons

  • Users can choose the canvas layout, size of boxes etc.

  • Items captured into a cell can include hierarchies, thereby facilitating use of subcategories and templates, if desired

  • Items captured are repository objects with relationships and any desired properties, which can include rich items such as documents, images, calculations etc. Items in the canvas have hyperlinks to view or edit these details

  • Items can be related in the canvas by drag and drop. Related objects are highlighted when the cursor is hovered over an item

  • Items can be included in any other tool view, including reports, generated documents, matrices and graphical models

  • Canvas views can be linked into menus for easy access by users collaborating on a shared repository. Since the tool is web based, these users can be anywhere

These innovations make canvasses very powerful! Take a look at the demonstration below.

Less INK more INQ* please

*Information Nutrition Quotient

Ink used to be the medium of communication and transferring knowledge and emotions. Text, diagrams and drawings. Its been largely superseded by digital images and video.
In the age of AI, we see more and more translation of a brief text into a waffly video. AI generated narrative, random vaguely related backgrounds and AI voice. A paragraph becomes a 7 minute video on YouTube. A click bait headline and we get sucked in.

This is all extremely inefficient.

In machine terms:

  • AI’s to generate the script, backgrounds, video and voice were trained on massive data sets in huge data centres consuming lots of power

  • AI’s did the generation (once, or multiple times if their driver tweaked things). The text inflated from a kilobyte or so to between 5 and 20 Mb depending upon resolution. It needed to be generated, encoded and compressed

  • Then it got uploaded, previewed and streamed/viewed n times. If it got viewed 1000 times, that’s 10 x 1000Mb =10 Gb of network bandwidth and storage. Client systems had to decompress, decode and render it…

In human terms:

  • Viewers spent 7 minutes each viewing it: 7000 minutes = 116 hours 40 minutes
    If the viewers were smart and tech savvy, they had their AI summarise it first, so that required some more processing (but many would have got the gist from the summary and not gone on to view it, saving their time)

  • The original text could probably have been read in <30 seconds, so wasted time was about 6500 minutes = 108 hours 20 minutes

I contend that the message could also have been distorted quite severely in this process!

Maybe we should just share the original prompt as a LinkedIn or similar post??

I propose a new metric, viz: Information Nutrition Quotient (INQ).

This is the useful information in a message (text, document, model, video) divided by the size of the message and the time/effort required from the receiver to process it (i.e. to successfully comprehend the message). Difficult to measure each of these factors, but the concept is still valuable. Try to encode the maximum useful information in the minimum bulk of message. Remember the ten commandments fit on two tablets, the US Constitution fits on four (large) pages and the entire syntax of Smalltalk on a postcard.

Models for Transfer of Perception

Research on physiology of the visual system, neuroscience and cognition shows our perceptions are controlled hallucinations based on predictions, progressively refined by feedback of sensory input.

Perception starts, not with sensory input from the eyes, but with a prediction in the brain. We then look for confirmation of our prediction in the sensory input. Where we detect anomalies, the brain adjusts the prediction and seeks new evidence. This has profound implications for models to share our perceptions.

First, we need to consider the receiver’s world view & experience and their likely predictions, which affect how they interpret what we share. If we can translate our message to a medium, format and notation that corresponds to what they are familiar with, we are far more likely to succeed. For a database designer, using UML diagrams is a good strategy. For a risk manager, this will fail, but they may be receptive to a diagram that categorises information according to risk parameters such as sensitivity to exposure and impact of exposure. It will help if we prime the expectation (and hence the prediction) with defining shared concepts. Ontologies are valuable in providing the nouns for later communication.

Enterprise Architecture benefits from a strong meta model defining the agreed concepts, relationships and properties we deem important that describe instances of the concepts. The meta model and appropriate tools (repository and modeling, query, reporting and visualisation) allow us to collaborate, to share and support multiple formats, notations and frameworks to work successfully with different communities.

The theory of communication (Shannon and Weaver) advocates redundant information in the message and feedback to the sender to ensure that messages were successfully transferred. For visual models, this translates to providing “dual coding” i.e. both symbols and text to facilitate correct perception of the information. We should also query the receiver to ensure they perceive what we intended to convey.

Efficiency can be enhanced using principles from compression of messages (e.g. in transmission of images, audio or video), where prediction is also used to predict what comes next and then to only transmit information if the actual signal differs. E.g. in a video we only transmit the changes from frame to frame, a very small proportion of the full image of the frame. For models, this translates to providing only difference or exception models, or models where the important information is highlighted in some way, by colour, modifying symbols or other means. In this way we have a lot less to encode and interpret. Again, competent tools can assist by providing filters, query, summary and highlighting mechanisms to generate useful outputs, potentially “on the fly”.

We are researching these topics and progressively enhancing our tools and methods at Inspired.org. Let’s connect!

Quality in Architecture

Architecture is about change. Not change for change sake. Real change that produces value and leads to Desirable Futures that enhance delivery of value to all stakeholders, incl. customers, employees, shareholders, business partners and society at large. Futures that enhance people’s lives. To deliver that change, what we produce (including the internal ones) have to be delivered at quality. That said, it is surprising how few architects understand Quality Management. This post will explore a few fundamentals.

Quality is not a vague “goodness” it is defined as Conformance to Requirements. OK, but whose requirements? Well, everyone affected. E.g. If we are introducing a new product or service this will include: customers, service personnel, business partners, the organisation (represented from a financial perspective by the CFO), other board members with responsibilities such as compliance, return on investment), regulators, implementors (who design, build, test and deploy the product) and support and maintenance personnel. Requirements include functional aspects: “what must it do?” as well as non-functional aspects: “How should it do it?”. E.g. function: “Generate Energy” and non-functional: “With minimal noise and pollution & at least as efficient as existing options”.

The performance standard is Zero Defects. This means meeting requirements, not perfection. E.g. A power generation service should produce energy 99.99% of the time and be recoverable in < 1hr if it does go down. Provided it performs within these parameters, it is considered “Zero Defect”.

The System of Quality should be Prevention rather than Appraisal. The latter focusses on inspections at the end of the lifecycle to stop bad product/service going out the door. This is necessary, but not sufficient. We need to track down root causes of deviations and eliminate them. This is prevention. Using prevention, we only spend on correcting a given type of error once, reaping recurring benefits on every instance of the process / product / service delivered. Spend on prevention yields continuous improvement. The rate of spend determines the rate of improvement.

The Price of Quality is measured as the Price of Conformance plus the Price of Non-Conformance. The former includes all costs to ensure we do the best job and make it Right First Time. Examples include training, methods, standards, inspections, tools etc. The latter includes all costs incurred because something was not right. Examples are: waste of materials, waste of time, financial loss, consequential damages, loss of reputation etc.

Using prevention, the Cost of Quality is lowest at Zero Defects. This is great news and gives us the empirical rationale for allowing and doing great work. Proof is the remarkable 2-3x improvements in productivity realised by organisations like Hitachi Software and Computer Sciences Corp by focussing on quality and eliminating errors early, i.e. in requirements.

Positive Risk? Should we take more risk? If so, why?

Watching Rory Sutherland, I saw an example where avoiding a small risk eliminated a major innovation opportunity.

As a one-man plumber, we must do each job well and follow proven best practices to avoid reputational damage and future business harm. The cost of a botched job is significant and may harm our cash flow. We’re likely risk-averse.

As a larger plumbing enterprise, we can spread risk by allowing one plumber to try a new approach. If the job fails, it won’t significantly impact our cash flow since other plumbers are operating normally. Even if we have an unhappy client, the other 19/20 or 95% will still recommend us, so our reputation is high. If we address the issue, we can restore 100% satisfaction.

By spreading risk across the organization, we can make it relatively small. If the new approach is successful, it can save us 20% effort on similar jobs, increasing our margin or profit and recurring over time.

We can divide risk (limited to one job and one client) while multiplying benefits by team size and job frequency. However, we must define success (e.g., client satisfaction and time or resource savings) and measure these. If the innovation fails, we must stop doing it.

If we want to limit the downside further, we can partner with the client where we intend to try it. Many will accept some risk if we pass on the savings or benefit. They’ll also tolerate problems or glitches more happily if they’re informed upfront.

Taking this into account, we need to be more tolerant of taking controlled risks and bringing in innovation, especially in large organizations.

The graphic shows a concept we introduced two decades ago for bringing innovation into an organization in a controlled way. A small number of innovators try out new things that may be beneficial. For those that are, they create proofs of concept and do some organizational learning, distilling how we can usefully use the technology or approach. The methods group translates their learnings into how these would be applied in the organization at scale and trains the operational teams in how to apply them. The operational teams apply what they’re taught and measure the results, feeding back to the methods group. This way, we exploit the effects of innovation - large infrequent gains, sometimes through radical change, while limiting the negative effect of taking the whole organization through a learning exercise and drop in productivity. The cycle of improvement, application, measurement, and improvement between the operational and methods groups exploits the principles of Kaizen, viz. small continuous incremental improvements, leading to high quality and efficiency.

Be a force for good

Give me a place to stand and a lever long enough..

and I will move the world. So said Archimedes, apparently.

When we train you as an architect, particularly a business architect, we are giving you a long lever (= much power). We also hope to give you some solid principles and moral grounding as a place to stand. Architects are change agents.

Be a force for good.

For each change that you propose, ask:

  • Which stakeholders will this impact positively? How? To what extent?

  • Which stakeholders (and potentially other parties) will this impact negatively? How? To what extent?

  • Then try to maximise the good and minimise the harm

  • Apply systems thinking to anticipate consequences

  • Ensure we are thinking long term and that proposed approach is sustainable

  • Try on a small scale (think MVP, prototype, etc. ) to prove concept, benefits, identify negative impacts

  • Iterate and improve or pivot before scaling up. Scale when benefits are being realised

  • Design and adjust metrics to get desired behaviour

  • Involve everyone affected (or at least their representatives) in the design of the future. Those closest often have knowledge that we don’t. They have history of what has been tried. They have ideas to contribute. They need to be on board to help make the change. If roles are affected or eliminated, people need better and significant roles to play going forward.